Model Training & Evaluation Report
Executive Summary
This report presents the development and evaluation of machine learning models for static malware detection using the Brazilian Malware Dataset. The objective was to build classifiers capable of distinguishing between malware and goodware based on Portable Executable (PE) file header features.
Best Model
Xgboost
Cross-Validation AUC
0.9980
Test Set AUC
0.9978
Dataset Overview
| Total Samples | 50,181 |
|---|---|
| Features | 27 |
| Memory Usage | 167.52 MB |
| Train/Test Split | 80/20 (Stratified) |
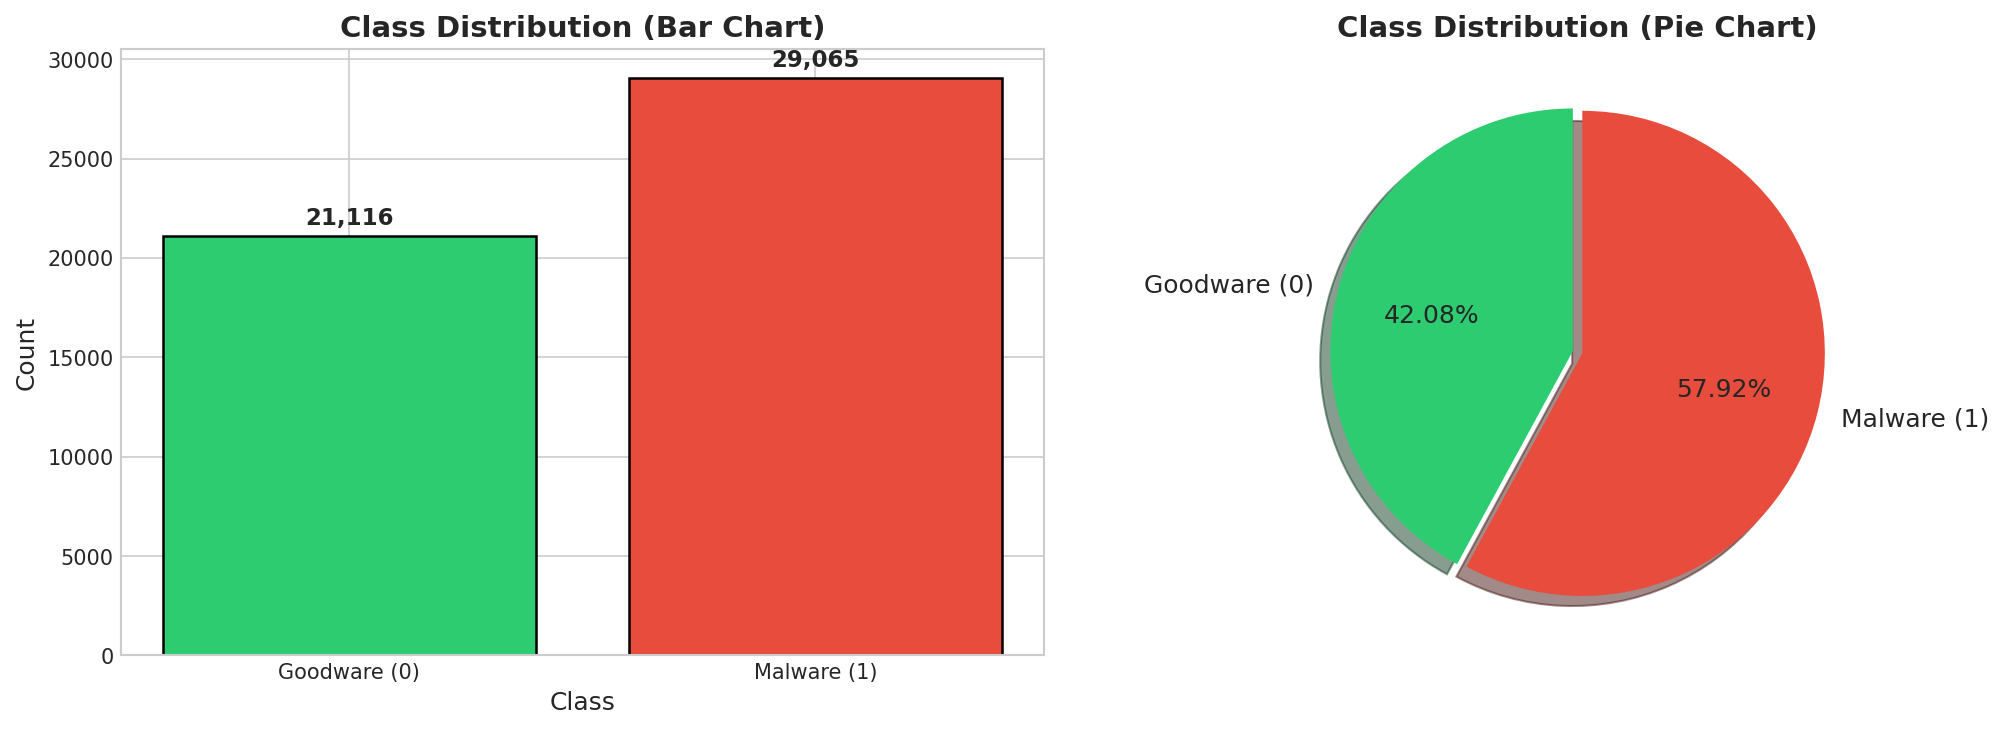
| Goodware (0) | 21,116 (42.08%) |
|---|---|
| Malware (1) | 29,065 (57.92%) |
| Imbalance Ratio | 1.38 |
Class Distribution
Exploratory Data Analysis
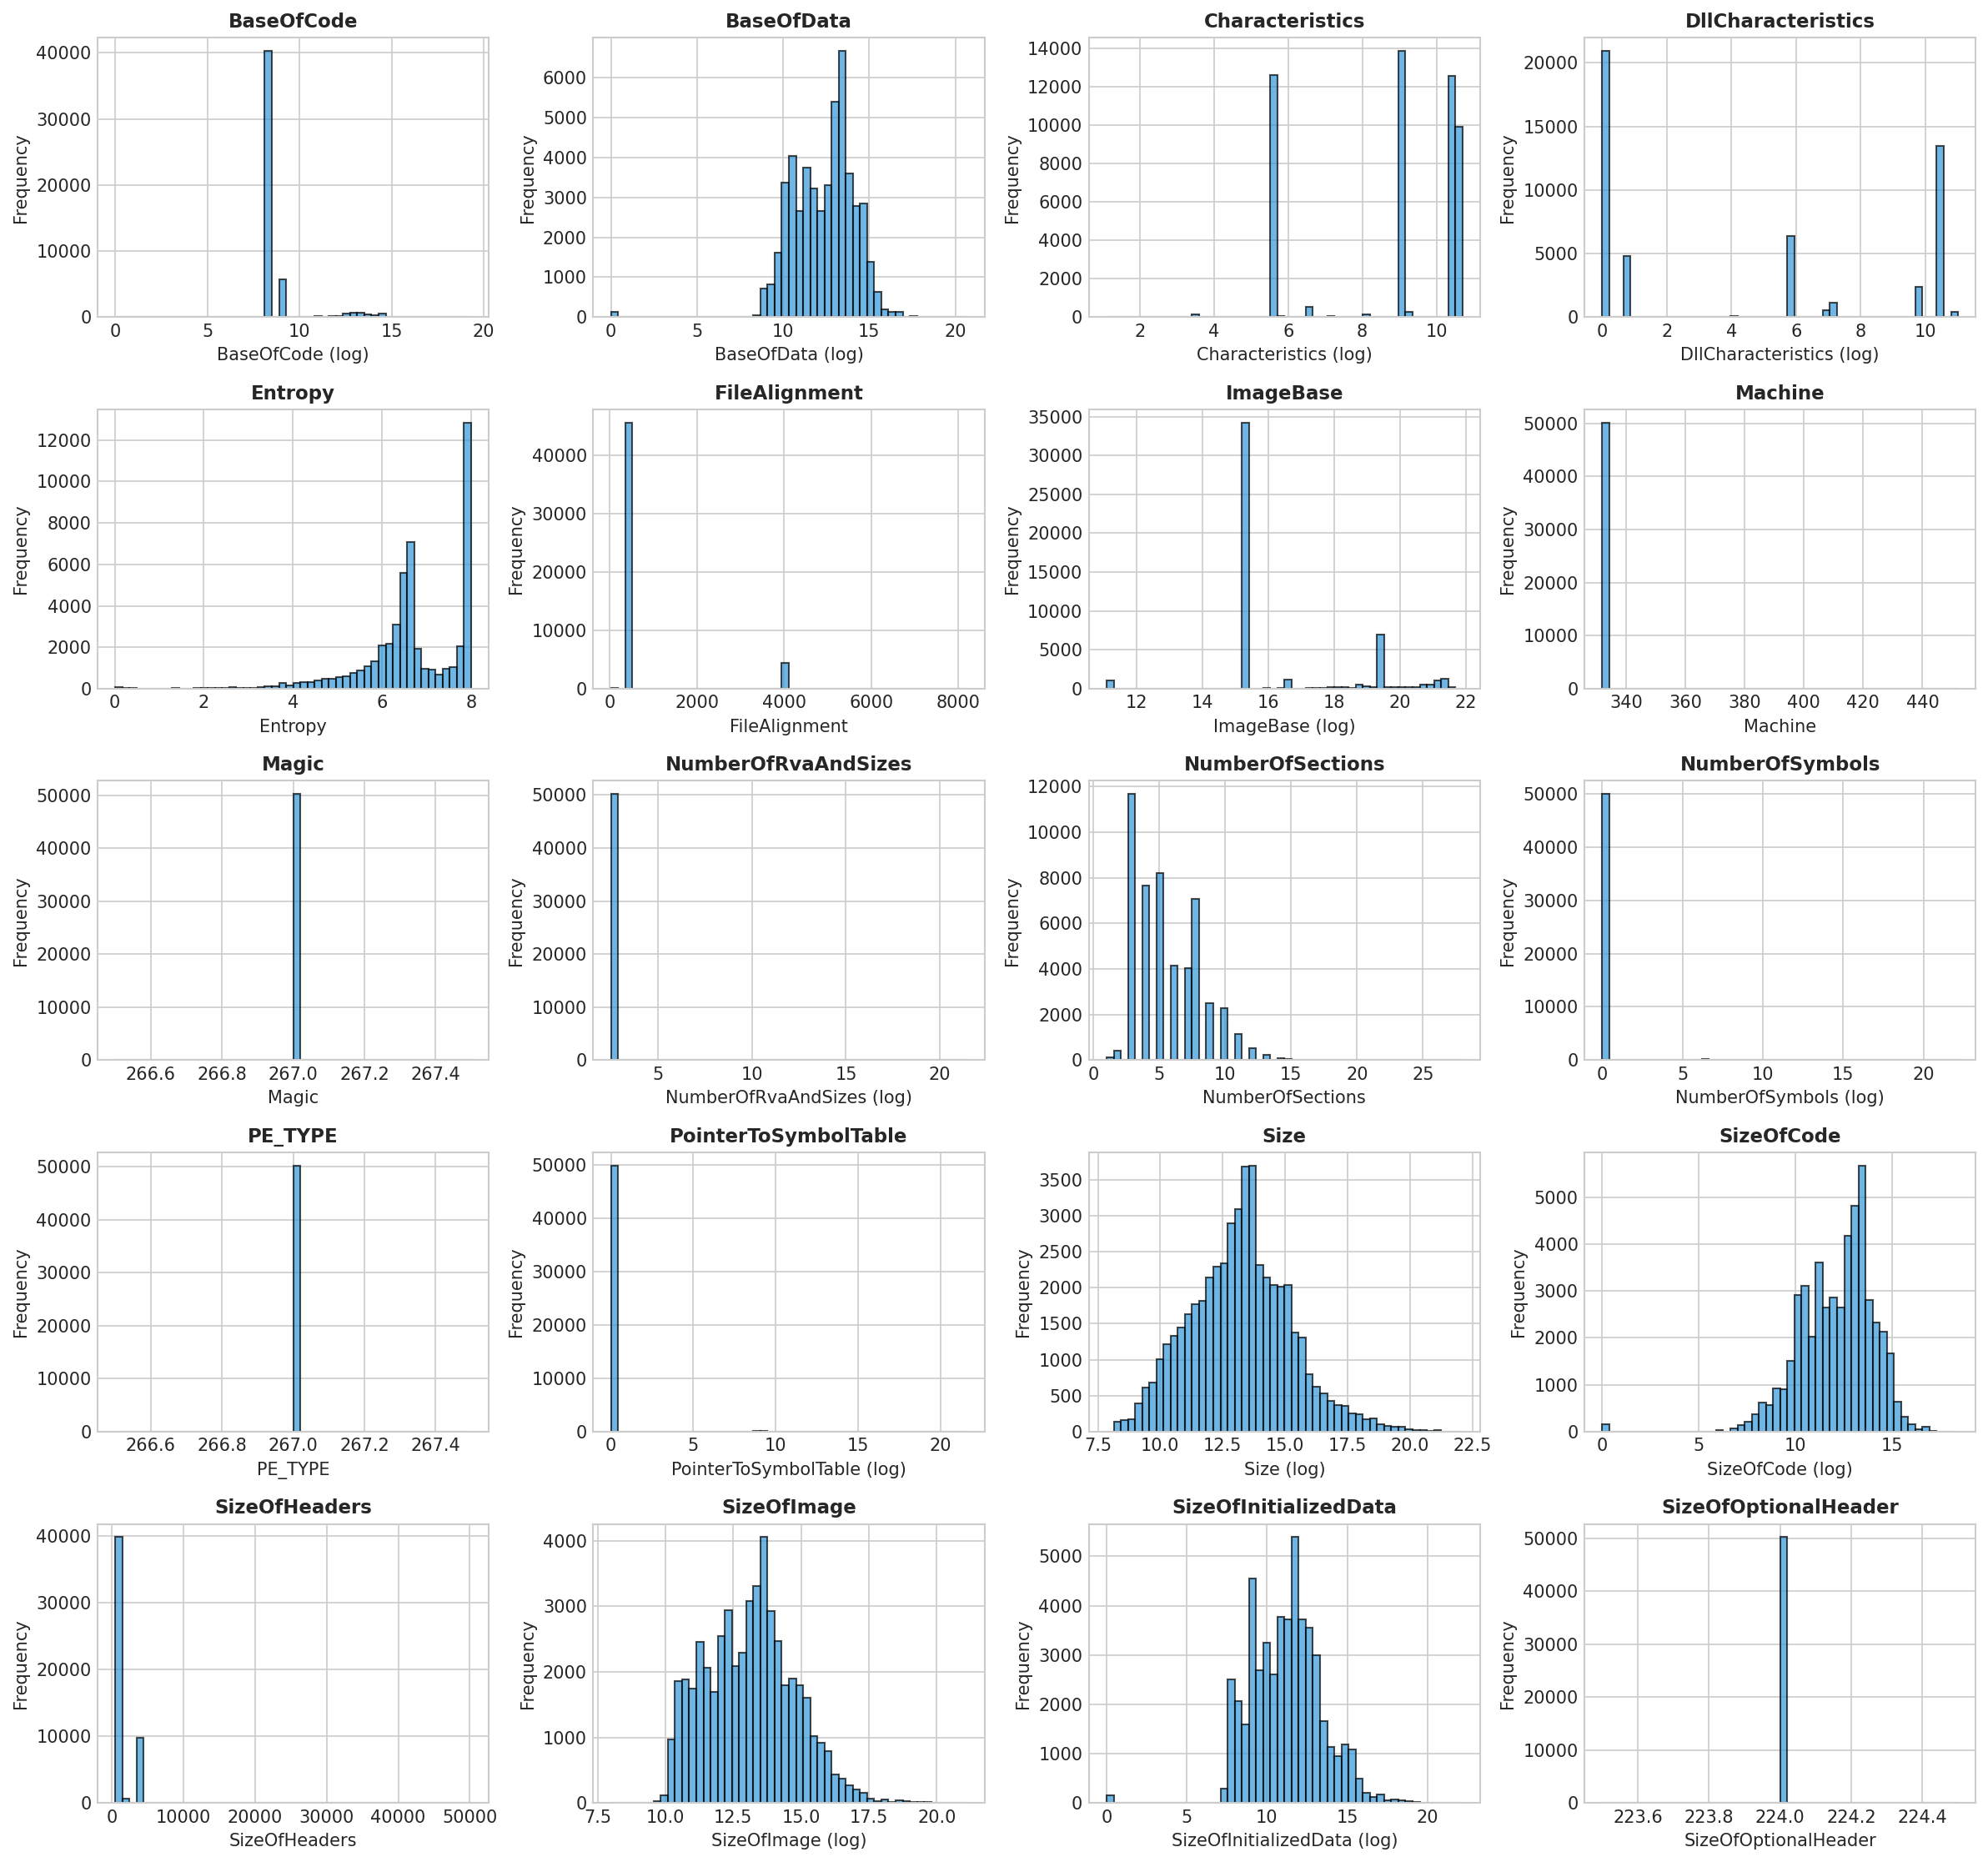
Feature Distributions
Distribution of numeric features in the dataset (log-scaled where appropriate).
Correlation Analysis
Feature correlation matrix showing relationships between features and with the target variable.
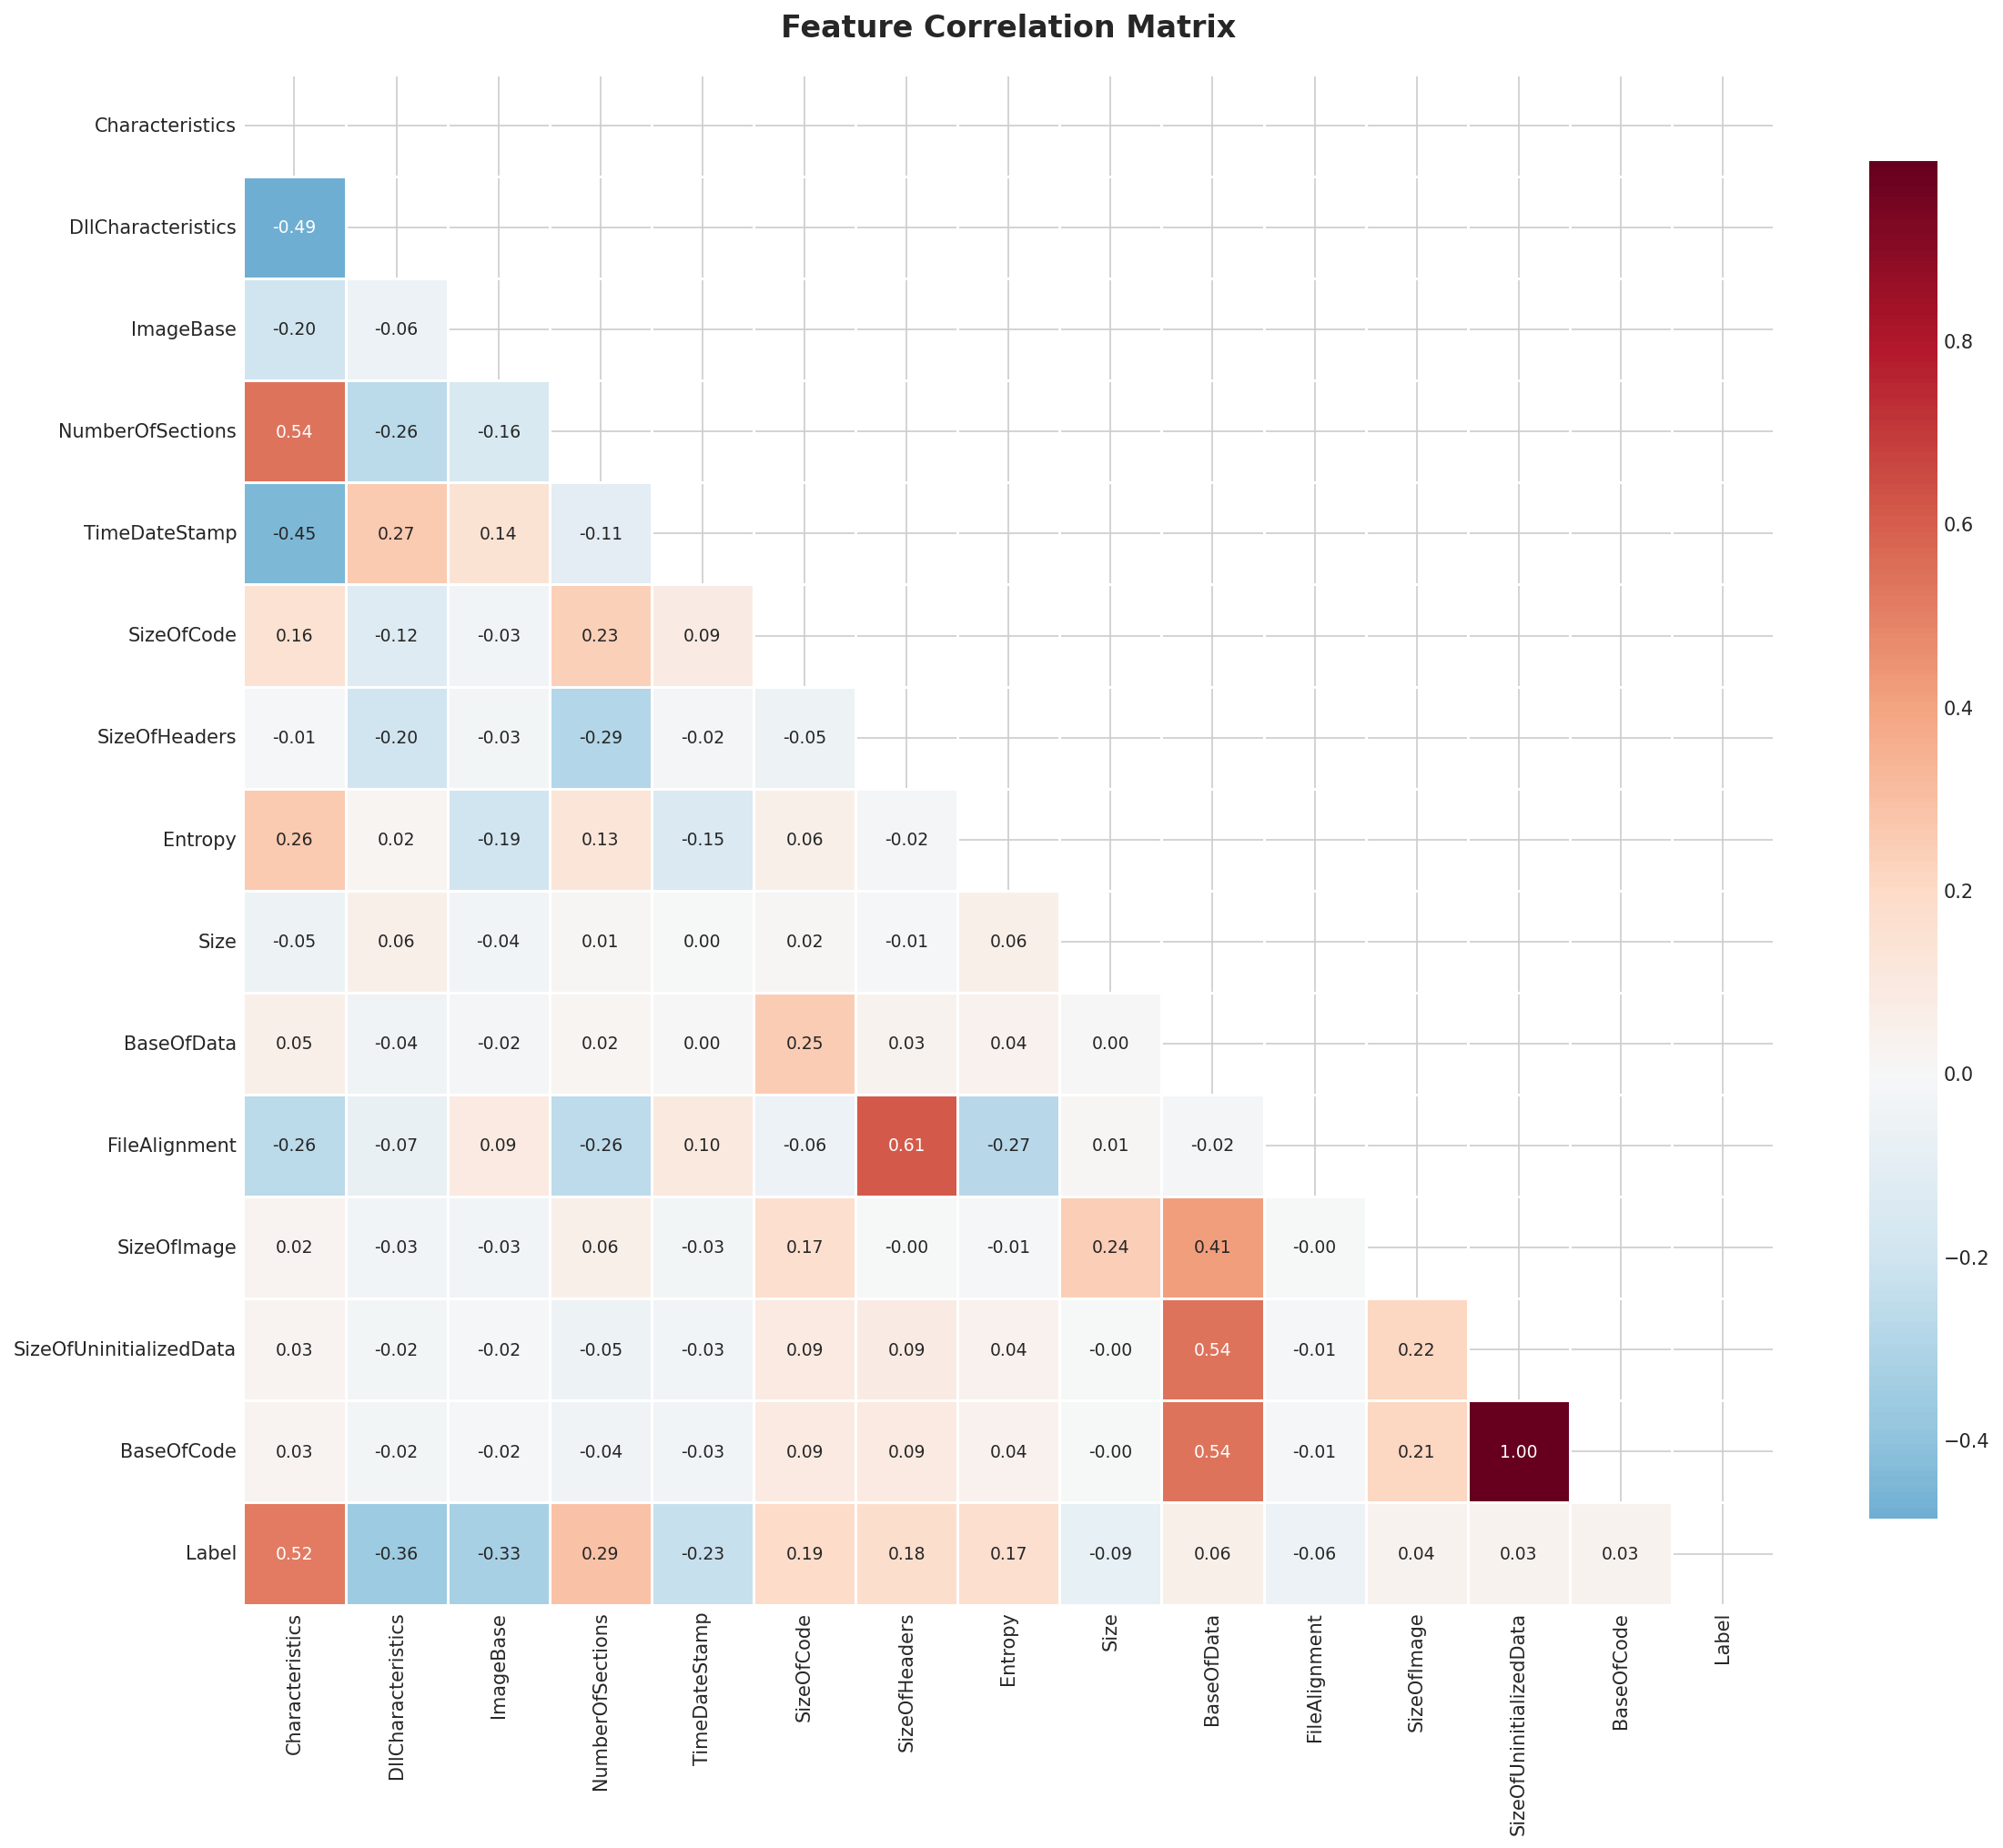
Top Features Correlated with Target:
Characteristics: 0.5172
DllCharacteristics: 0.3631
ImageBase: 0.3252
NumberOfSections: 0.293
TimeDateStamp: 0.2267
Entropy Analysis
Entropy is a key indicator for packed/encrypted malware. Values above 7 often indicate suspicious content.
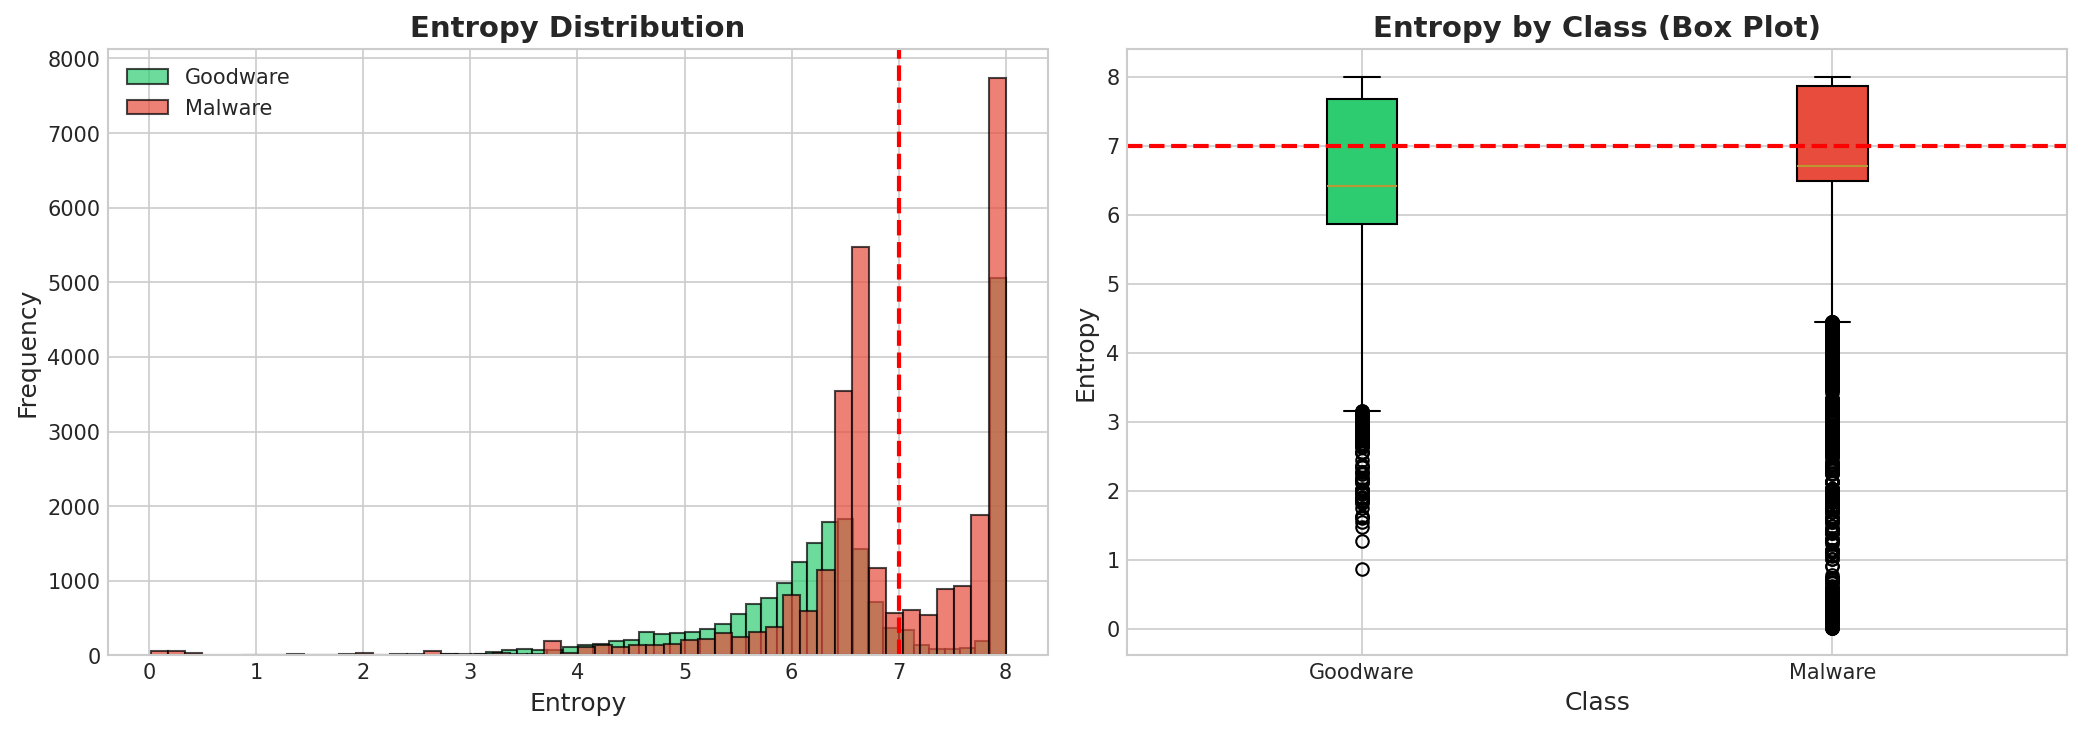
Mean Entropy
6.6945
High Entropy Files (>7)
18,744
Goodware Mean
6.4681
Malware Mean
6.859
Model Training & Cross-Validation
Experimental Setup
- Data Split: 80% training, 20% hold-out test set (stratified)
- Cross-Validation: 10-fold stratified CV for model selection
- Primary Metric: AUC (Area Under ROC Curve)
- Secondary Metric: Accuracy
- Preprocessing: Median imputation, Standard scaling
Cross-Validation Results (Sorted by AUC)
| Rank | Model | AUC (Mean) | AUC (Std) | Accuracy (Mean) | Accuracy (Std) | F1 (Mean) |
|---|---|---|---|---|---|---|
| 1 | Xgboost | 0.9980 | 0.0005 | 0.9868 | 0.0022 | 0.9886 |
| 2 | Lightgbm | 0.9976 | 0.0004 | 0.9838 | 0.0016 | 0.9860 |
| 3 | Random Forest | 0.9976 | 0.0007 | 0.9881 | 0.0018 | 0.9897 |
| 4 | Catboost | 0.9972 | 0.0005 | 0.9838 | 0.0018 | 0.9860 |
| 5 | Pytorch Mlp | 0.9827 | 0.0019 | 0.9424 | 0.0045 | 0.9504 |
| 6 | Decision Tree | 0.9803 | 0.0014 | 0.9810 | 0.0014 | 0.9836 |
| 7 | Logistic Regression | 0.8775 | 0.0054 | 0.8195 | 0.0063 | 0.8315 |
Best model highlighted in green. CV results show mean ± standard deviation across 10 folds.
Feature Importance
Most predictive features from the best performing model.
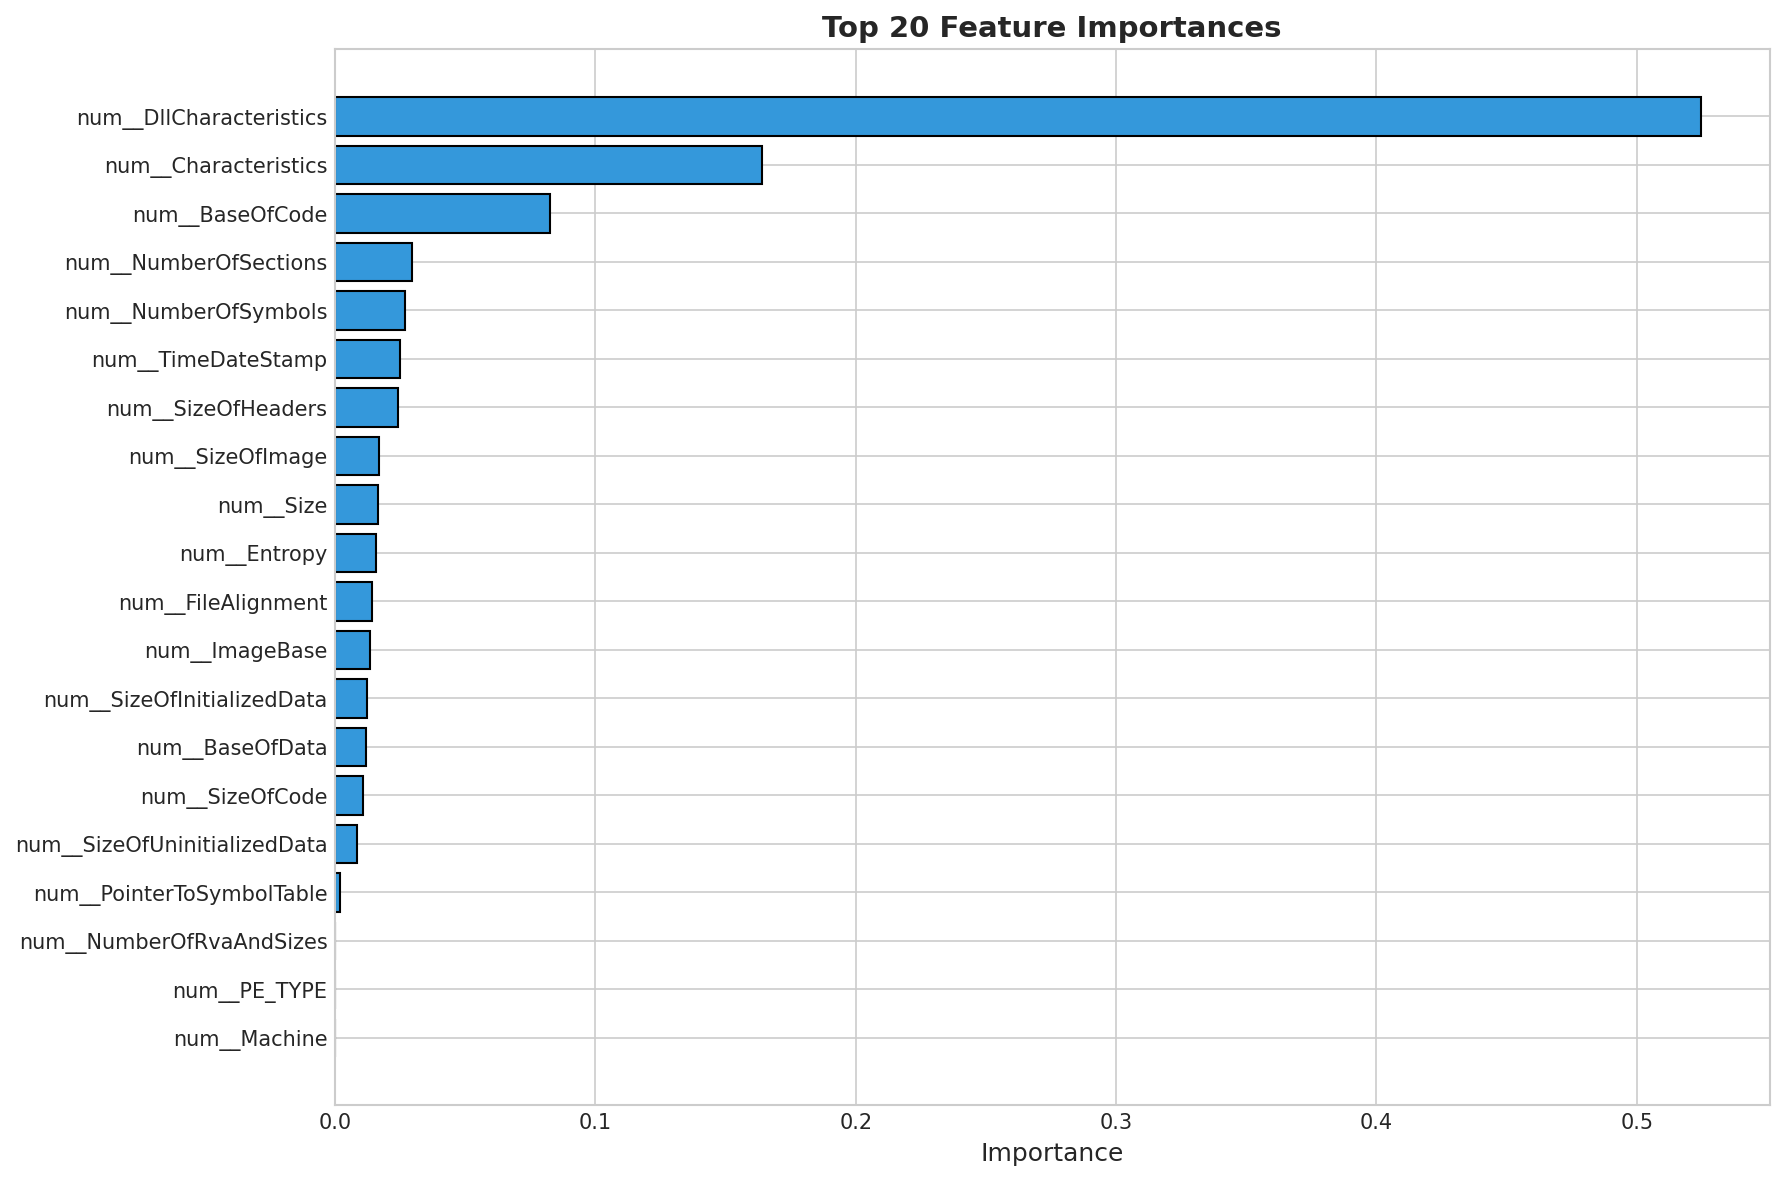
Top 5 Most Important Features:
- num__DllCharacteristics: 0.5247
- num__Characteristics: 0.1640
- num__BaseOfCode: 0.0828
- num__NumberOfSections: 0.0295
- num__NumberOfSymbols: 0.0270
Final Test Evaluation
Performance Metrics on Hold-Out Test Set
| ROC AUC | 0.9978 |
|---|---|
| Accuracy | 0.9881 |
| F1 Score | 0.9898 |
| Precision | 0.9888 |
| Recall | 0.9907 |
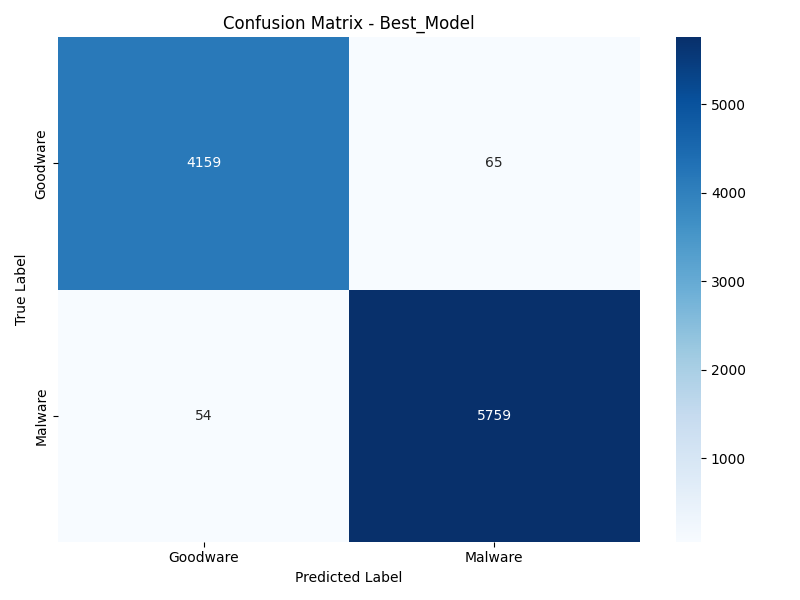
Confusion Matrix
ROC Curve
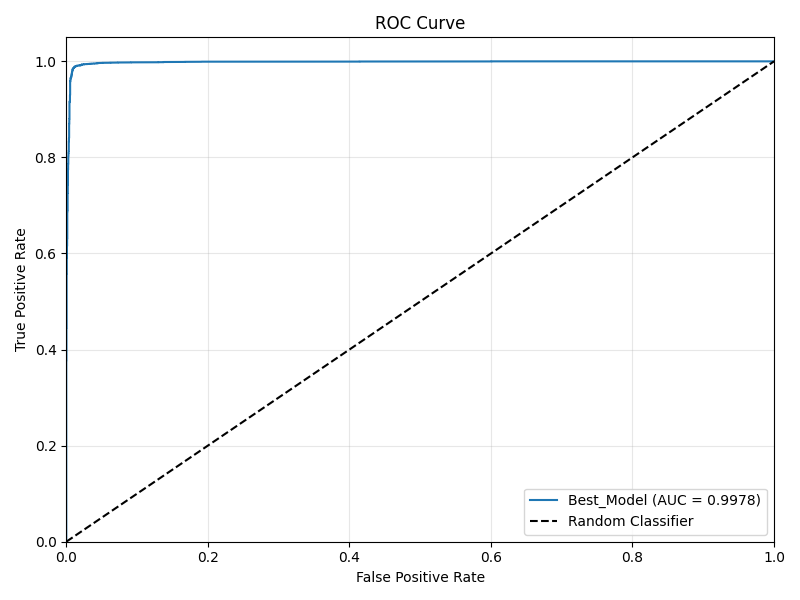
Conclusions
- Model Performance: The best model achieved an AUC of 0.9978 on the hold-out test set, demonstrating strong capability in distinguishing malware from goodware.
- Feature Importance: Analysis revealed that entropy, section characteristics, and executable metadata are among the most predictive features.
- Deployment: The model is packaged into a production-ready Flask web application with CI/CD pipeline.
- Recommendation: This system should be used as part of a comprehensive security strategy, not as the sole detection mechanism.